
10 Key Metrics for Measuring the Success of Whistleblowing Programs
Setting up a whistleblowing program is a key step for any firm. It shows a commitment to ethics and duty. However, just having a whistleblowing program isn't enough. You must also measure its success. This post looks at 10 key metrics to track. It uses data from the 2026 NAVEX Benchmark Report to show what a healthy program looks like.
Key Takeaways
- Measuring a whistleblowing program's success is as vital as setting it up.
- Key metrics include report volume, resolution time, and the ratio of anonymous reports.
- Global benchmarks show a rise in reports, with a median of 1.65 reports per 100 staff in 2025.
- New EU rules from 2026 will add report types like AI Act violations to compliance desks.
- Web-based intake has now overtaken phone hotlines as the primary source for reporting.
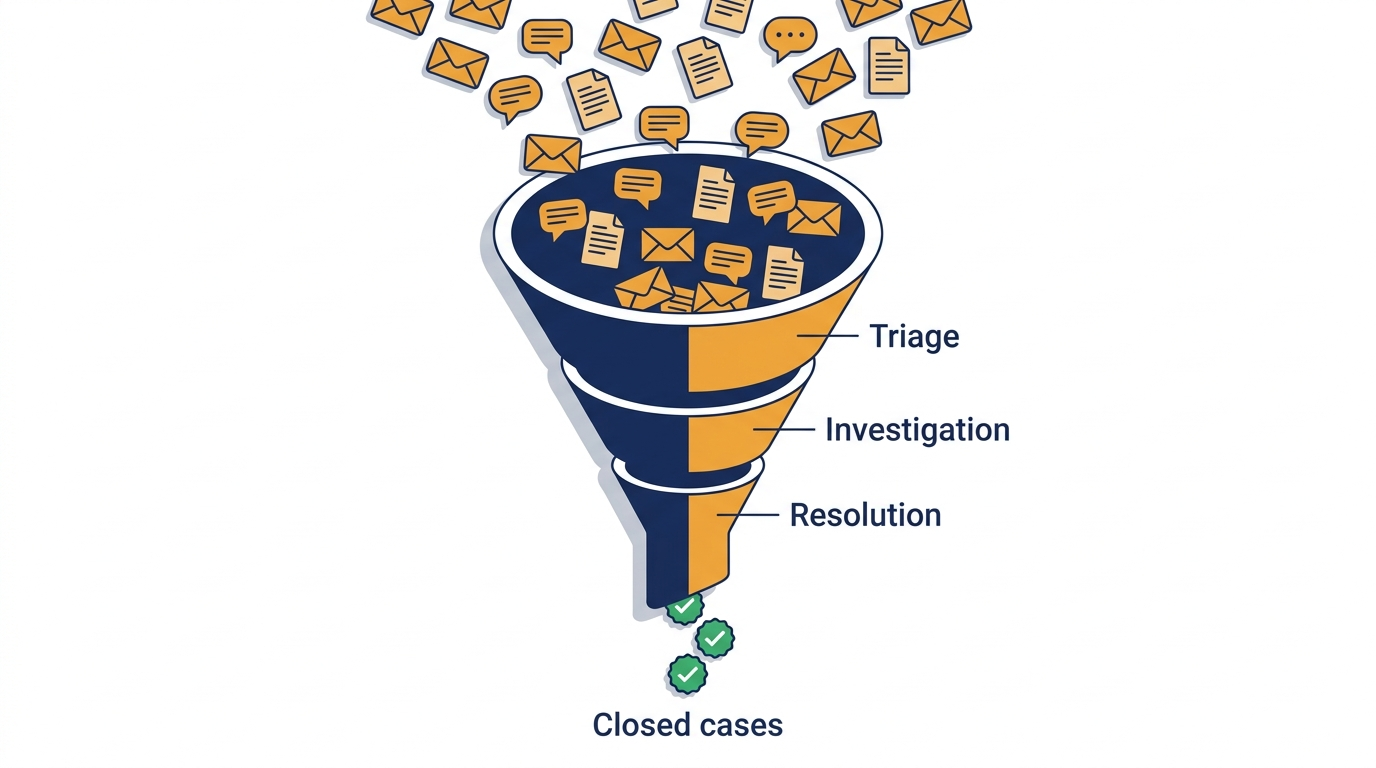
From intake to resolution, every metric in this article tracks one stage of this pipeline.
Why measurement matters more in 2026
The rules have changed since this list was first written. Authorities in France and Germany now fine firms that don't have reporting channels. The EU is also pushing states to improve safety for those who speak up. They want to ensure the EU Whistleblower Directive is followed by everyone.
Starting in August 2026, the law will cover the EU AI Act. This means new types of reports will arrive. These include model misuse and biased systems. Programs that can't sort reports by type will struggle to find these AI cases.
Global standards like ISO 37002:2021 are also moving this way. They treat measurement as a duty, not just a nice feature. Boards now expect to see real numbers, not just stories.
The 10 metrics, with 2025 benchmark numbers
- Number of Reports Received: Total volume is a key number, but it needs a benchmark. The median is now 1.65 reports per 100 staff. This is a record high. Less than 1.0 per 100 often signals a lack of trust. Growth usually shows a healthy culture.
- Report Resolution Time: Timely resolution of reports builds trust. The median time to close a case is now 28 days. This is up from 21 days. Cases about workplace culture are taking longer. North America closes cases in 19 days, while Europe takes 69.
- Anonymous vs. Non-Anonymous Reports: This ratio shows how much staff trust the channel. In 2025, 65% of reports in Europe were anonymous. In North America, it was 52%. A high share of anonymous reports is fine. But a sudden jump might mean people are becoming more afraid.
- Nature of Reports: Sorting reports by type shows what your firm is facing. Workplace culture issues are now the most common. From August 2026, you will also need to track EU AI Act violations.
- Repeat Reports: This metric tracks if the same people report issues more than once. It helps find deep problems that one-off checks miss. A rising number here might mean earlier fixes didn't work.
- Employee Satisfaction: Numbers tell you what happened, but surveys tell you if it felt fair. Use pulse surveys to see if staff would use the channel again. If reports are high but satisfaction is low, your system may not be solving the real issues.
- Incident Resolution Rate: This is the share of reports that prove to be true. The median is now 44%. Retaliation claims are only proven true in 16% of cases. Imminent threats have a much higher rate of 83%.
- Legal Consequences: Track how many reports lead to real action. This includes firing, discipline, or legal cases. Firing occurred in 20.2% of proven cases in 2025. This shows if your investigations have teeth.
- Organizational Culture Assessment: Look at other signals like exit interviews. A healthy program grows as staff feel safe to flag bad acts. If reports go up while other signs stay flat, you are likely catching things others miss.
- Whistleblower Protection: Most firms say they care about safety, but few measure it. Retaliation reports make up about 3% of all cases. Only 16% are proven true. This low rate suggests these cases may need more focus.
The mix of named versus anonymous reports is one of the clearest read-outs of how much your people trust the channel in practice.
Don't compare apples to oranges across regions
Don't just look at global medians. Data varies by region. North America has 1.75 reports per 100 staff, while Europe has 0.67. A score of 0.9 is great in Europe but a warning sign in North America.
The time to report also varies. US staff take 8 days, while Europeans take 13. None of these is the "right" answer. They just show local culture and laws. Pick a regional set to compare yourself against. Don't compare a small firm to a global giant. That isn't a real test.
The intake-channel shift to watch
In 2025, web reporting hit 33.4%. It passed phone hotlines (29.5%) for the first time. The rest comes from emails and manager talks. This is a major shift in how people speak up.
This means "hotline stats" don't tell the whole story. You must track every way staff speak up. If a web form is hard to use, you won't see it in the mix right away. You'll only see slower closure times months later.
"Web intake has now surpassed hotlines."
NAVEX 2026 Whistleblowing & Incident Management Benchmark Report
Reporting these to the board
Once you have the numbers, you must decide who sees them. A good plan looks like this:
- Monthly reports for the compliance team: open cases and closure trends.
- Quarterly packs for the audit committee: proven rates and retaliation cases.
- Annual tests against global benchmarks: see how you compare to the NAVEX medians.
For a board summary, track these seven items: reports per 100 staff, closure times, anonymous share, and top types. Also track proven cases, retaliation, and how people report. If a number doesn't help make a choice, leave it off the page.
Measuring a program's success requires looking at many types of data. By using the 2026 NAVEX report, you can see where you stand. This helps you improve and build a better culture. Regular reviews help keep the trust of your staff. Remember that benchmarks will change as new laws like the EU AI Act take hold from August 2026.
HR coordinator and corporate ethics expert. Writes on workplace culture, employee protection, and making whistleblowing part of everyday work.


